We put TVs through their paces to find out which models have the best picture and sound quality, and don't just look good.
Choosing what to test
Every year, from March to June, manufacturers generally release more models than we can possibly test. We liaise with manufacturers to find out what will be released and plan our testing based on that information, along with market information on what sold well the previous year.
Lifetime score
Our overall score combines test performance (how well the TV works) with predicted reliability (how likely models from the brand are to remain free of faults) and brand satisfaction (how likely owners of TVs from the brand are to be very satisfied).
Tested vs predicted scores
In addition to the models we test, we now also publish predicted models. We use years’ worth of test data and machine learning to predict how a model similar to those we've tested will perform.
When predicting scores for televisions, we look at the brand, screen type and size, and price. For example, predicting the scores for a Samsung LCD TV is based on our test results for other Samsung LCD TVs of the same size within the same price bracket.
We only publish predicted scores where we have a high level of confidence, based on consistent test results across multiple similar models we've tested. The scores we display are the median of the interval of scores predicted by the tool.
For more detail on our predicted scores, see We’re trying something new – so you can compare more products.
Test performance
New TV technology gives us brighter, more saturated pictures all the time, as well as larger screens and higher refresh rates. UHD (4K) TVs have become the norm, retailing at lower prices.
Our testing is a comparison of the relative merits of each TV against others we've tested. We use reference TVs to check our scoring is consistent and ensure each batch is compared to the same standard.
Our technical staff have 30 years of testing televisions between them. They’ve seen the progression from bulky cathode ray tube TVs to plasma sets, on to LCD and now OLEDs. They’ve also sat on standards committees to ensure the TV you buy is safe and they've had an influence in implementing mandatory energy performance standards.
New TV ports are always replacing old ones as higher resolution content requires more data transfer at faster speeds. We report less on analogue connections as these are becoming obsolete.
Our TVs test covers:
Performance (picture and sound quality)
Ease of use.
Performance
Our TV performance scores include:
UHD (4K) picture
HD picture
SD picture
Sound.
For the picture tests, our tester sets each TV’s colour as close as possible to the industry colour-balance standard that content creators use. Many TVs are set to a much cooler temperature in the factory because bluer pictures tend to look brighter and sharper in a showroom.
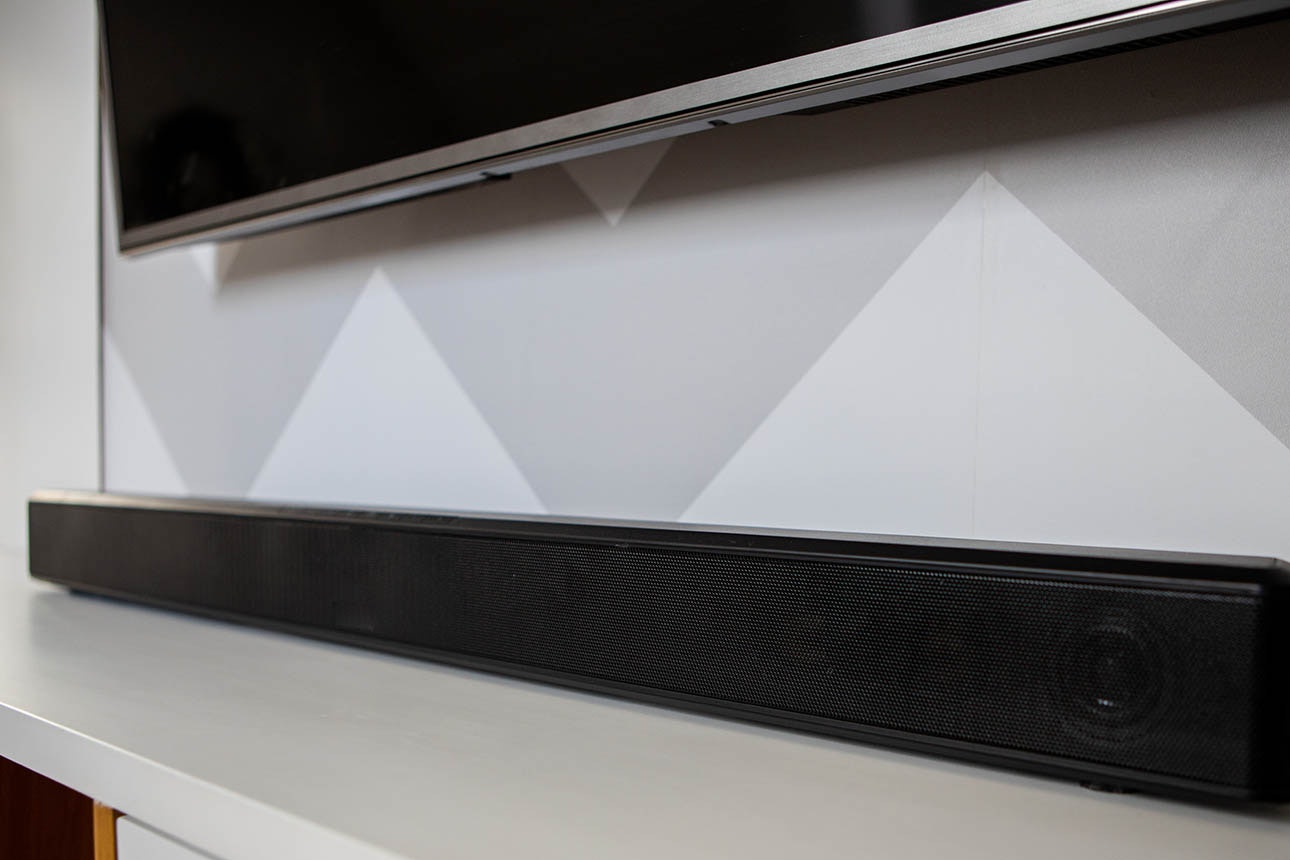
For the sound quality assessment, we play a number of high-quality voice and music recordings on a DVD player connected to the TV and compare the sound to a reference soundbar.
A panel of three experts then assess the TV at a volume loud enough for listening in a normal room and at the TV’s maximum volume (assuming this is louder).
The panel listen for clear voices, enough high-, mid- and low-frequency responses to provide some drama and presence, and any rattles, humming or obvious distortion.
Ease of use
We assess aspects that affect your experience of using the TV. This includes:
User interface: checking for simple and well-organised means of selecting options, easy to read characters, intuitive descriptions or symbols, stays on screen long enough, a guide on which keys to use, organisation of frequently viewed channels, and whether closed captions stay active when changing channels.
SmartTV functionality:
Ease of Home screen interface navigation and clarity.
Availability of apps (YouTube, Netflix, TV catch-up apps), whether they’re quick to access or must be searched for, app screen layout, how long it takes for apps to start up, how easy it is to use them with voice commands, and whether pre-installed apps can be deleted.
Embedded Chromecast and AirPlay capability.
Amount of home screen space taken up by advertising.
Whether automatic content recognition can be turned off in the settings.
Remote control: button and other controls - types, layout, anything missing (e.g. mute button, numeric buttons, favourites, Home), labelling, plus shape, size and comfort.
Energy use
We estimate the annual energy consumption of each TV based on their power use while playing and when on standby. Annual electricity costs can range from $25 for small, efficient screens to over $300 for 85-inch monsters, so it’s important to factor this in as an ongoing cost.
Predicted reliability
It’s reasonable to expect a new device to remain fault-free for the first five years. Our predicted reliability won’t tell you whether the TV will stop working tomorrow, but it does show which brands make models that are less likely to fail.
Brand satisfaction
Satisfaction is important – a big purchase should never be a source of buyer regret. TVs with very satisfied owners are more likely to remain in service for a long time, rather than getting dumped when a new generation of TV comes along.
Survey data
In our annual tech reliability and satisfaction surveys, consumers tell us about faults that have left a product they own unusable or mean they’ve had to change how they use it. We also ask them how satisfied they are with the product. We use their data to produce our predicted reliability and brand satisfaction scores.
We use a statistical test to rate the relative performance of each brand. Compared to data we have for all products of the same type in the survey, we rate each brand with highest, high, average, low or lowest for reliability and satisfaction. You can compare the rating of different brands for the same product type (for example, the reliability rating of Hisense and Sony TVs), but you can’t compare the results for different product types (for example, satisfaction of LG TVs and Samsung headphones).
We analyse brands that get at least 30 responses in our survey. That means there are some brands we can’t analyse because we don’t have enough data. For those brands, we assume they have average reliability and satisfaction.
Our data is based on 2,599 responses from owners of TVs in our 2026 survey.